Visualizing NBA 3 Point Shooters
August 25 2018I was listening to the recent Bill Simmons podcast with Stephen Curry, and they had a brief discussion of the best 3 point shooters . Simmons wussed out by choosing the four absolute safest choices (Curry, Reggie Miller, Ray Allen, and Klay Thompson). He then later covered by adding “specialists” like Dell Curry, Steve Nash, and Larry Bird. I was disappointed this discussion couldn’t go on much further (Simmons doesn’t want to offend Curry or other potential NBA players that will do his podcast), especially given Simmons’ stature as a basketball historian.
Anyway, the conversation got me thinking about visualizing 3 point shooters to identify great shooters, great seasons, and wacky seasons. I’ve followed the NBA since the early 90’s and have always had a healthy obsession with long-distance shooters (my first NBA fantasy team was named after Steve Kerr). This post is really just an excuse to take a trip down memory lane to see if the shooters I remember really did stand out. I want to be clear that this is not a discussion of who are the greatest 3-ball shooters (this reddit post makes an attempt at that).
The box stats for 3 pointers are super basic. Basically, there are three vectors to consider:
- frequency (how often the player shoots a 3)
- volume (how many times the player shoots a 3)
- accuracy (the success rate)
Advanced stats can get much more interesting (how open was the player? did the shot come off the dribble or from a pass? how much distance was traveled by the shooter prior to shooting?). Unfortunately, I don’t have access to any of those stats, so I’m just going to look at visualizations for the three basic ones.
Quick plug on the data:
- I’m using a free data set from DrGuillermo on kaggle. It had basic box score stats for every NBA player and season since 1950. It’s truly a wonderful set.
- It was missing the latest 2017-18 season, so I just manually added the information I needed from nba.com.
- For all visualizations, there is a requirement of at least 1000 minutes played and 100 3 point attempts per season. This is completely arbitary, but it helped in rooting out small sample size outliers. This also resulted in excluding many player/seasons from the 80’s. I’m ok with that. Sorry, Larry Bird.
For each of the visualizations below, I’ll just briefly highlight the things that stood out to me.
Careers: Accuracy vs. Volume
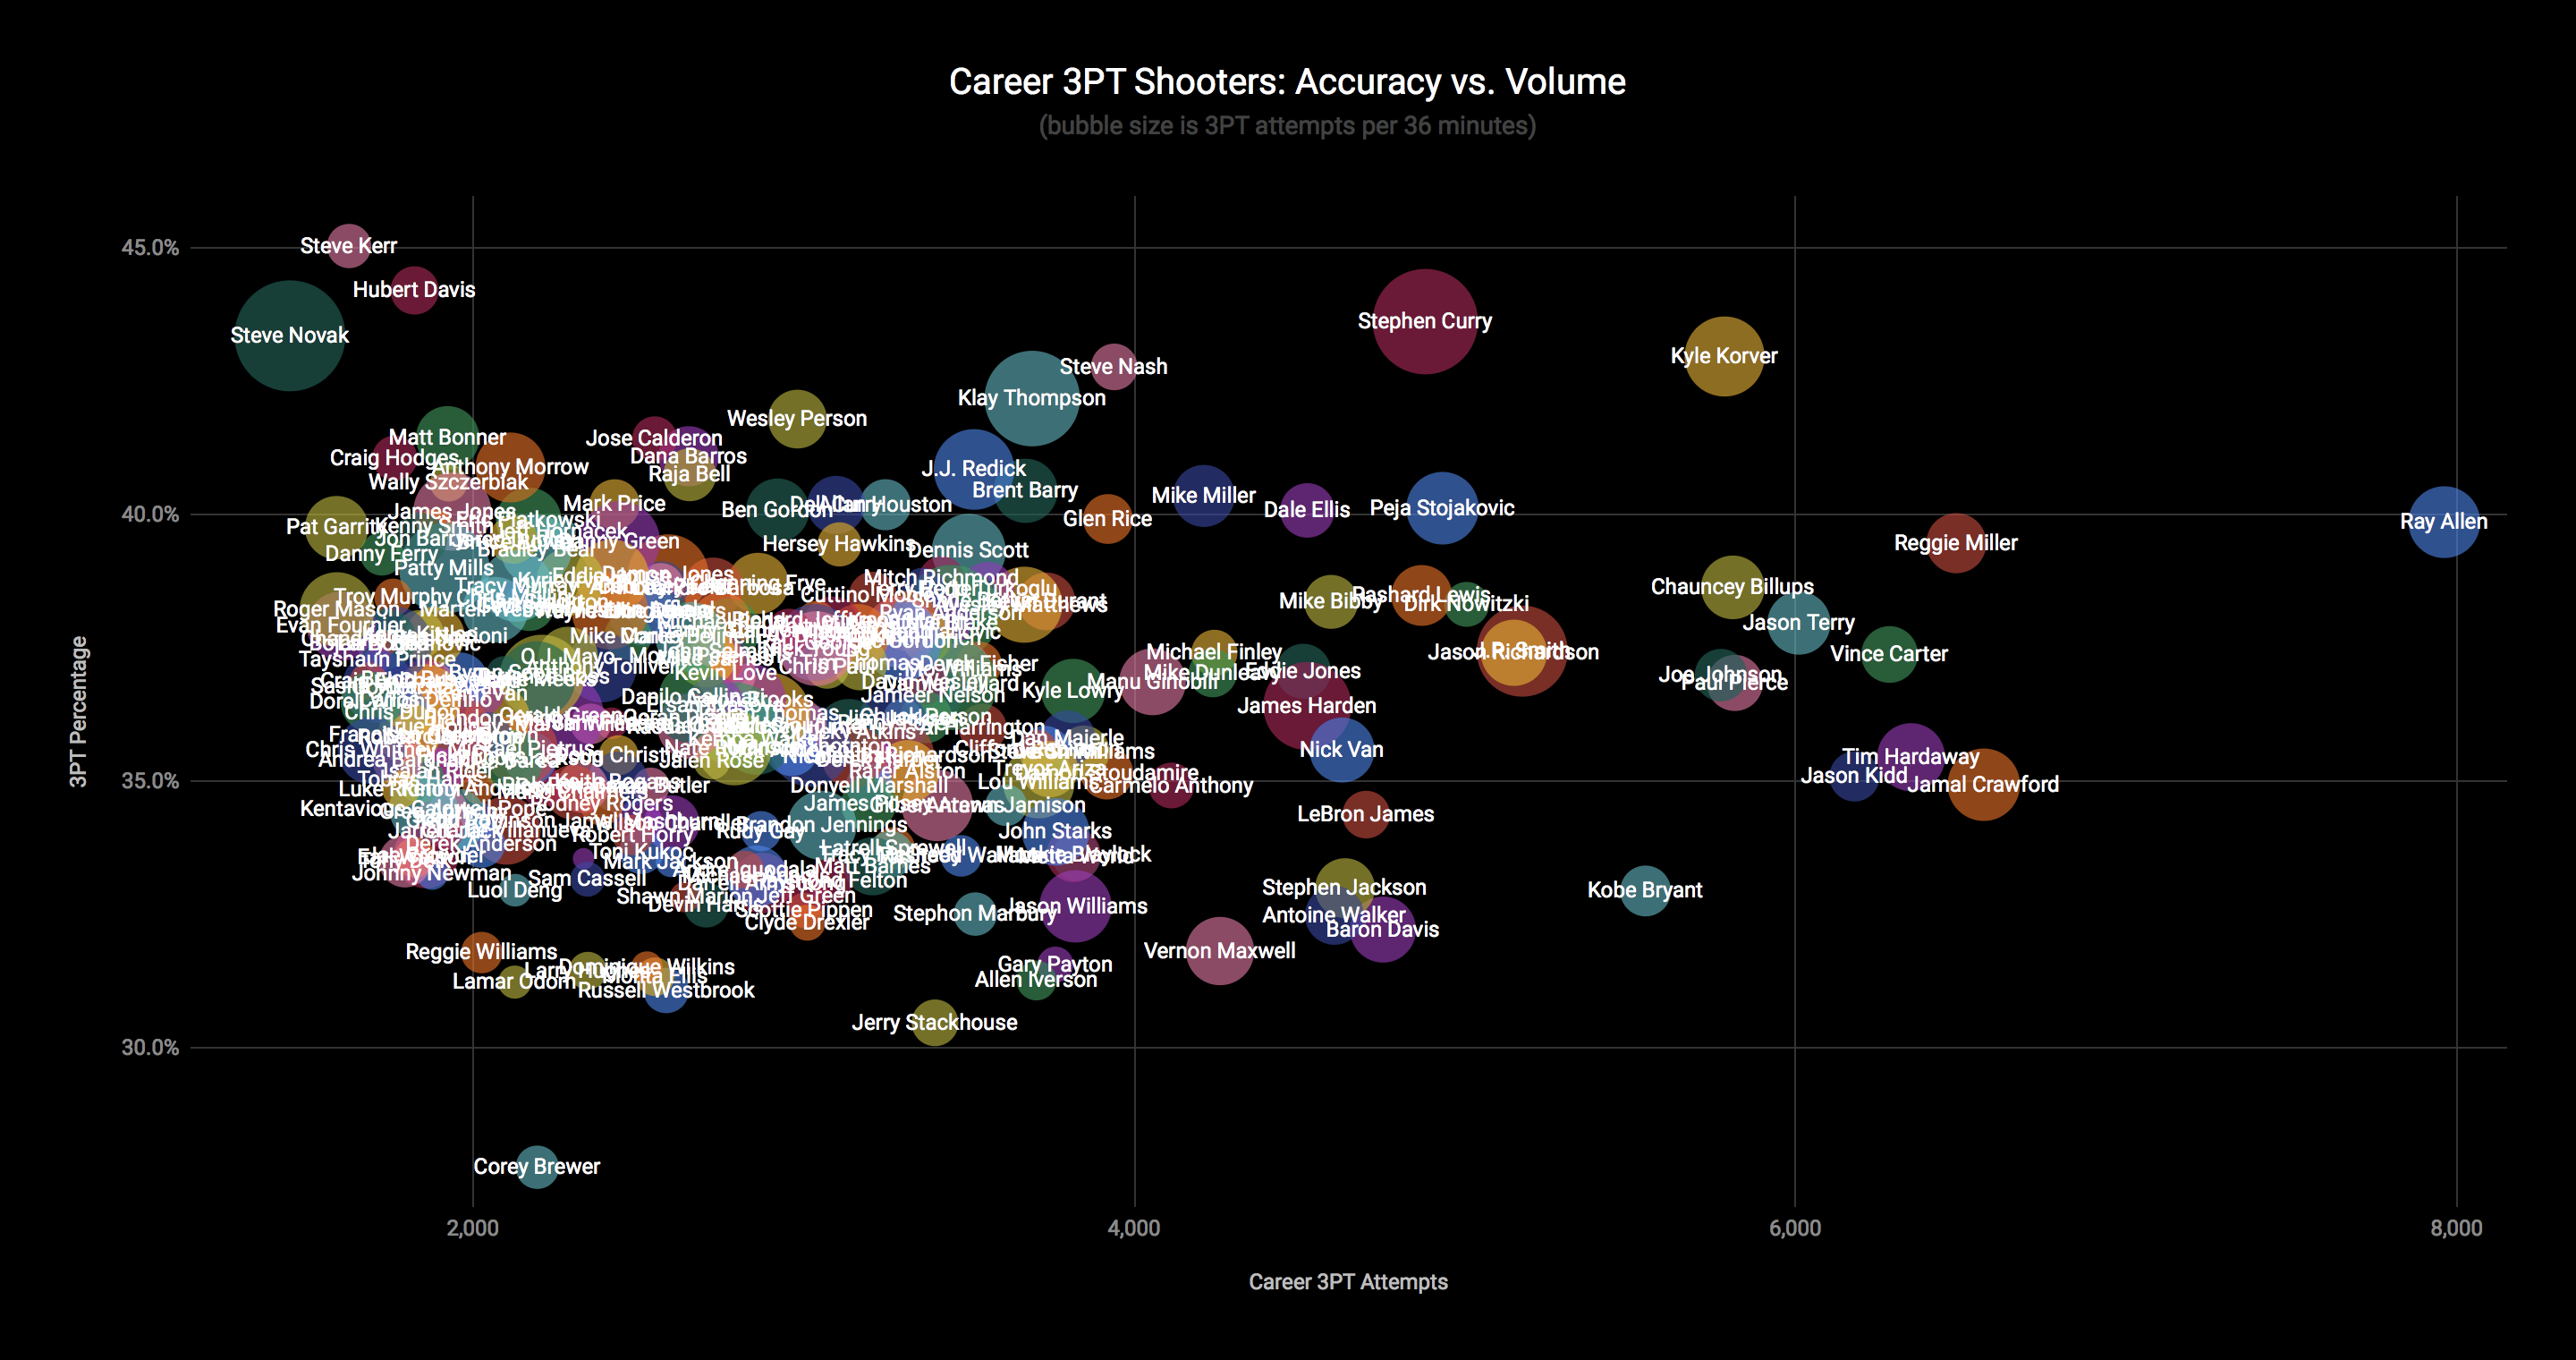
- This chart emphasizes the players that had long careers and big minutes.
- Ray Allen is just a monster when it comes to consistency over a long period. He shot 3 ball about 18% more times than Reggie Miller at a slightly higher accuracy.
- Kyle Korver is much further on the right in this chart than I would’ve expected. I’ve always thought of Korver as a low-minutes specialist. But he clearly stands out relative to other specialists like Steve Kerr or Mike Miller.
- Corey Brewer…LOL.
- There is an absolutely special cluster of players with Vernon Maxwell, Stephen Jackson, Antoine Walker, and Baron Davis. I remember all four of them as absolute chuckers, with no hesitancy to fire off a 3 and break up whatever play the coach had drawn up. One flattering thing for them is that LeBron and Kobe are not too far from them.
- I was surprised that Dirk Nowitzki and Peja Stojakovic did not feature more prominently on this chart. Dirk probably needs to be compared relative to other big men, in which case he is obviously an outlier. As for Peja, I guess he just didn’t play enough seasons.
Careers: Accuracy vs. Frequency
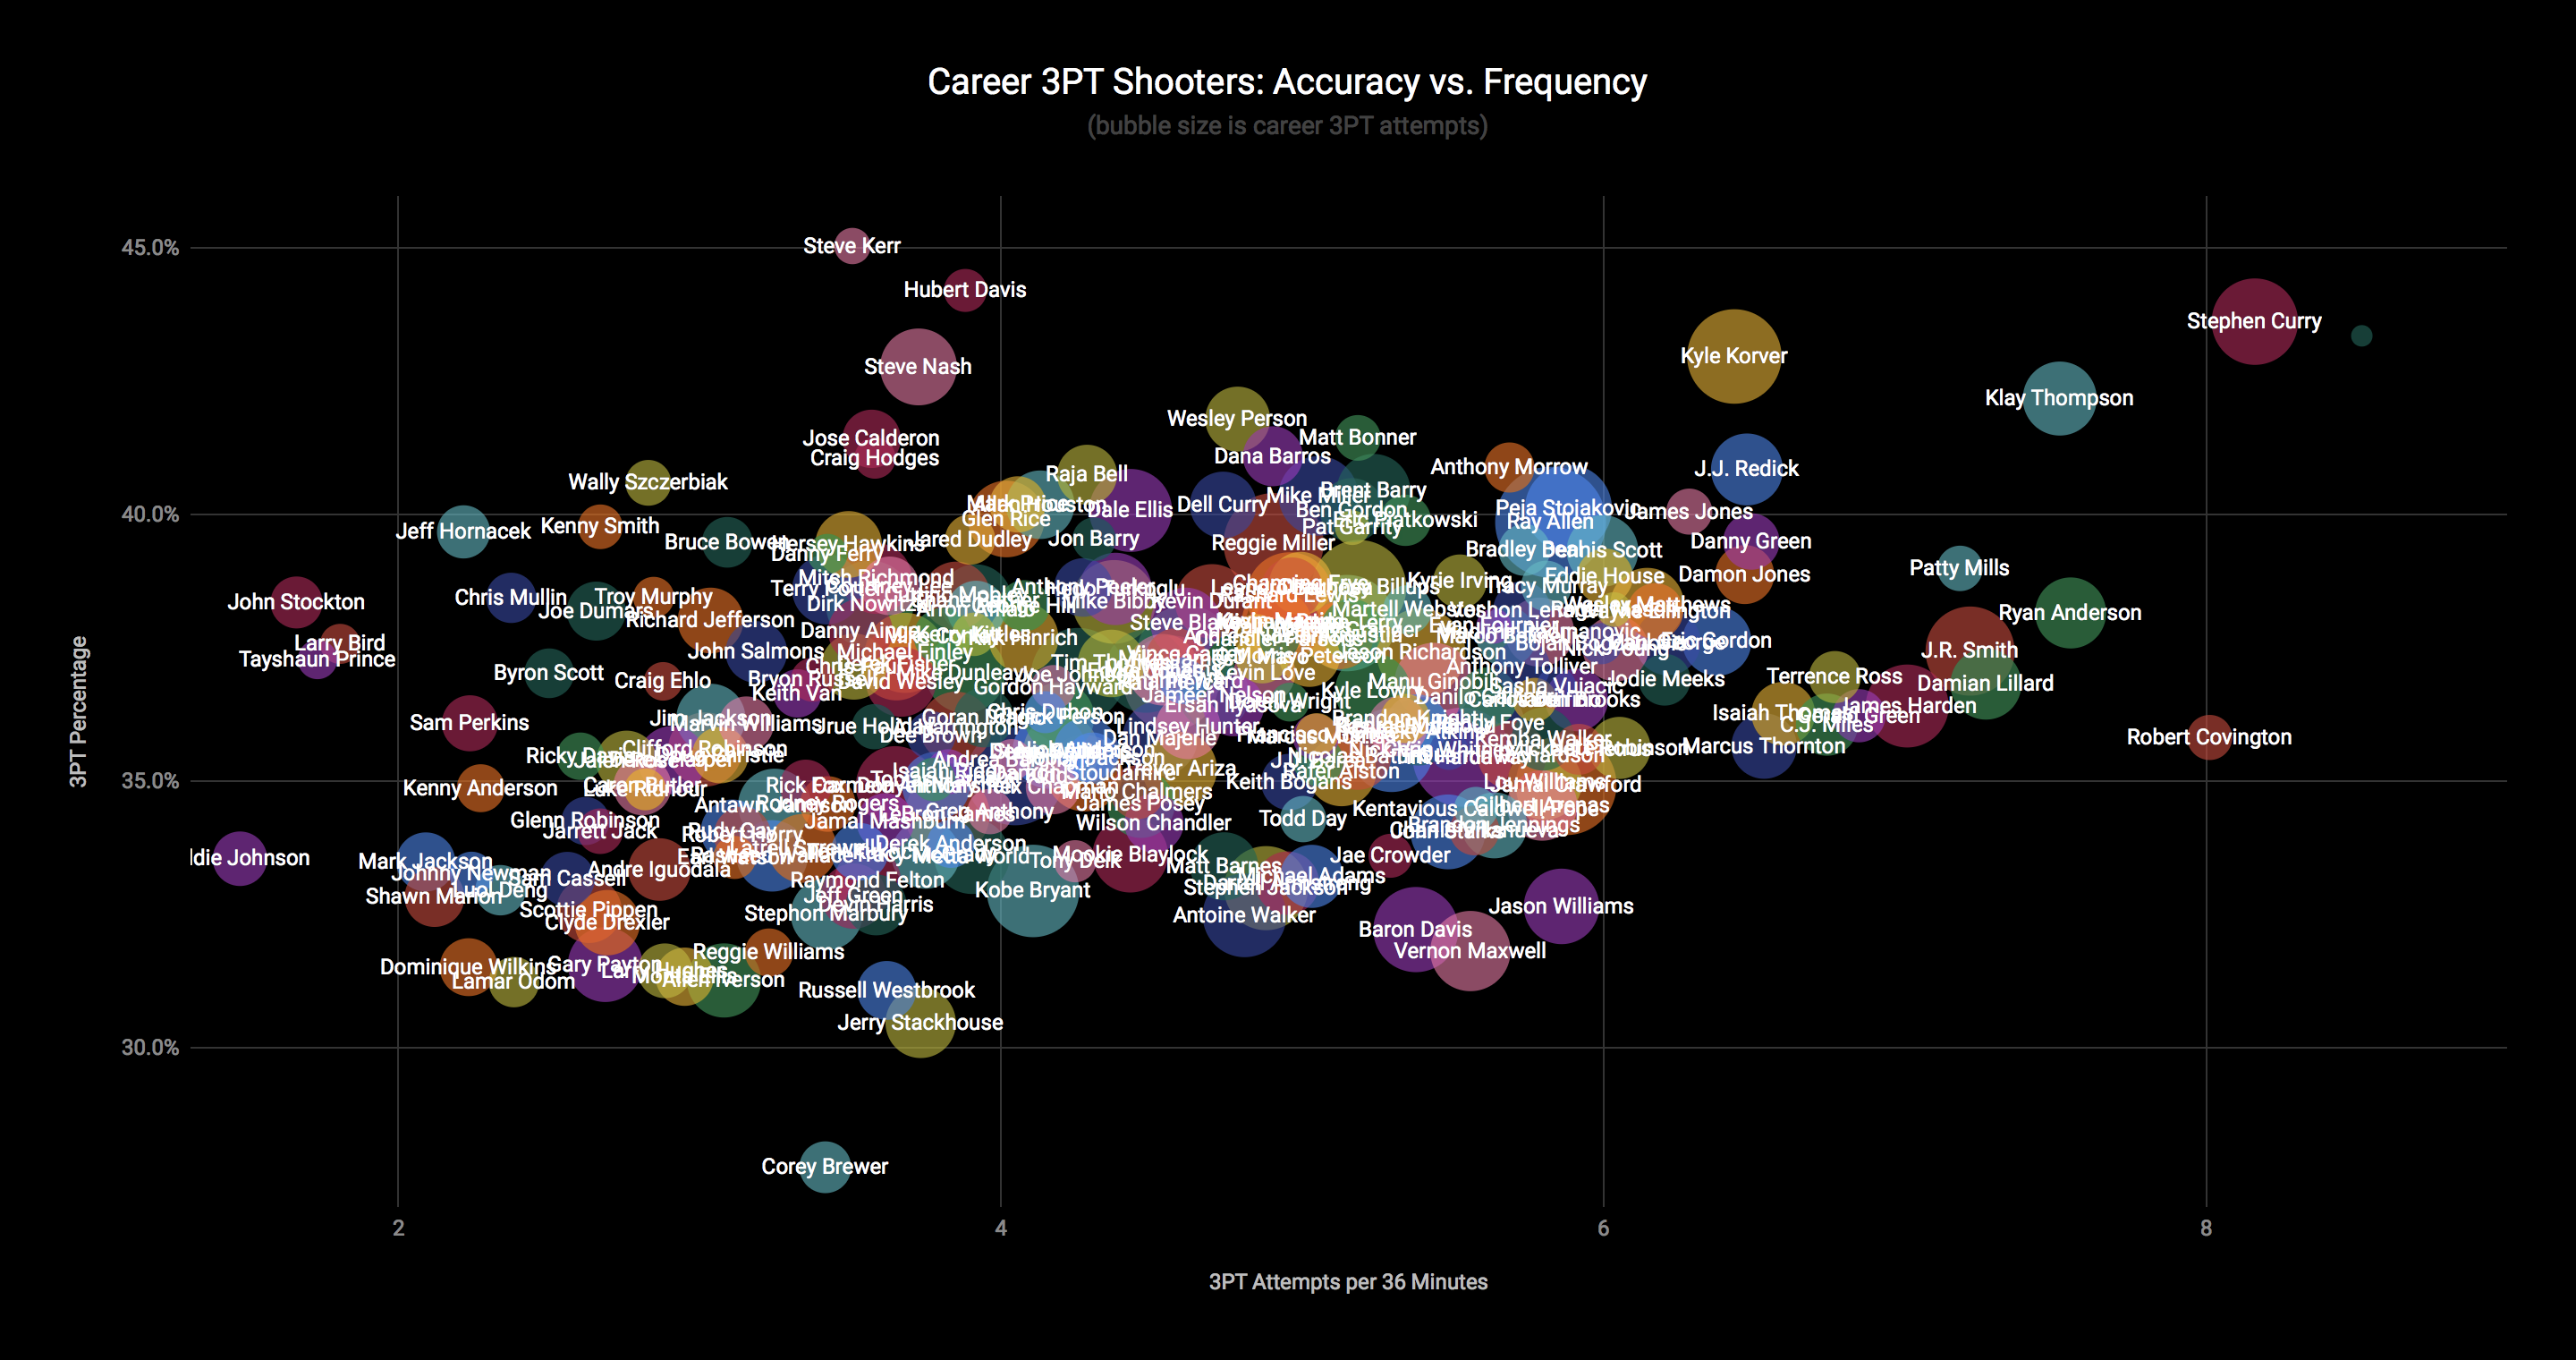
- This chart does a nice balance of capturing both modern shooters, who all jack at rates well above historical standards, and historical specialists that were lucky enough to play during the shortened 3 point line era (1995-1997).
- Steph, Klay, Korver, and Redick are probably the consensus current best 3 point shooters, and this chart does a great job of showing that.
- The little green speck next to Stephen Curry is Steve Novak. He didn’t really get enough minutes to feature prominently, but he had basically 1.5 glorious seasons with the Knicks (to be discussed later).
- Steve Kerr is still occupying the only real estate north of 45%. He really was wasted playing in the wrong era. If he played now, his size and lack of athleticism would still be an issue, but he’d be way more valuable, like a more accurate Damon Jones.
- Corey Brewer…still LOL.
- Still surprised not to see Peja more prominently on this chart. I guess he retired before the league went nuts with 3 point shooting, but I would’ve expected his accuracy to be a bit higher.
Seasons: Accuracy vs. Volume
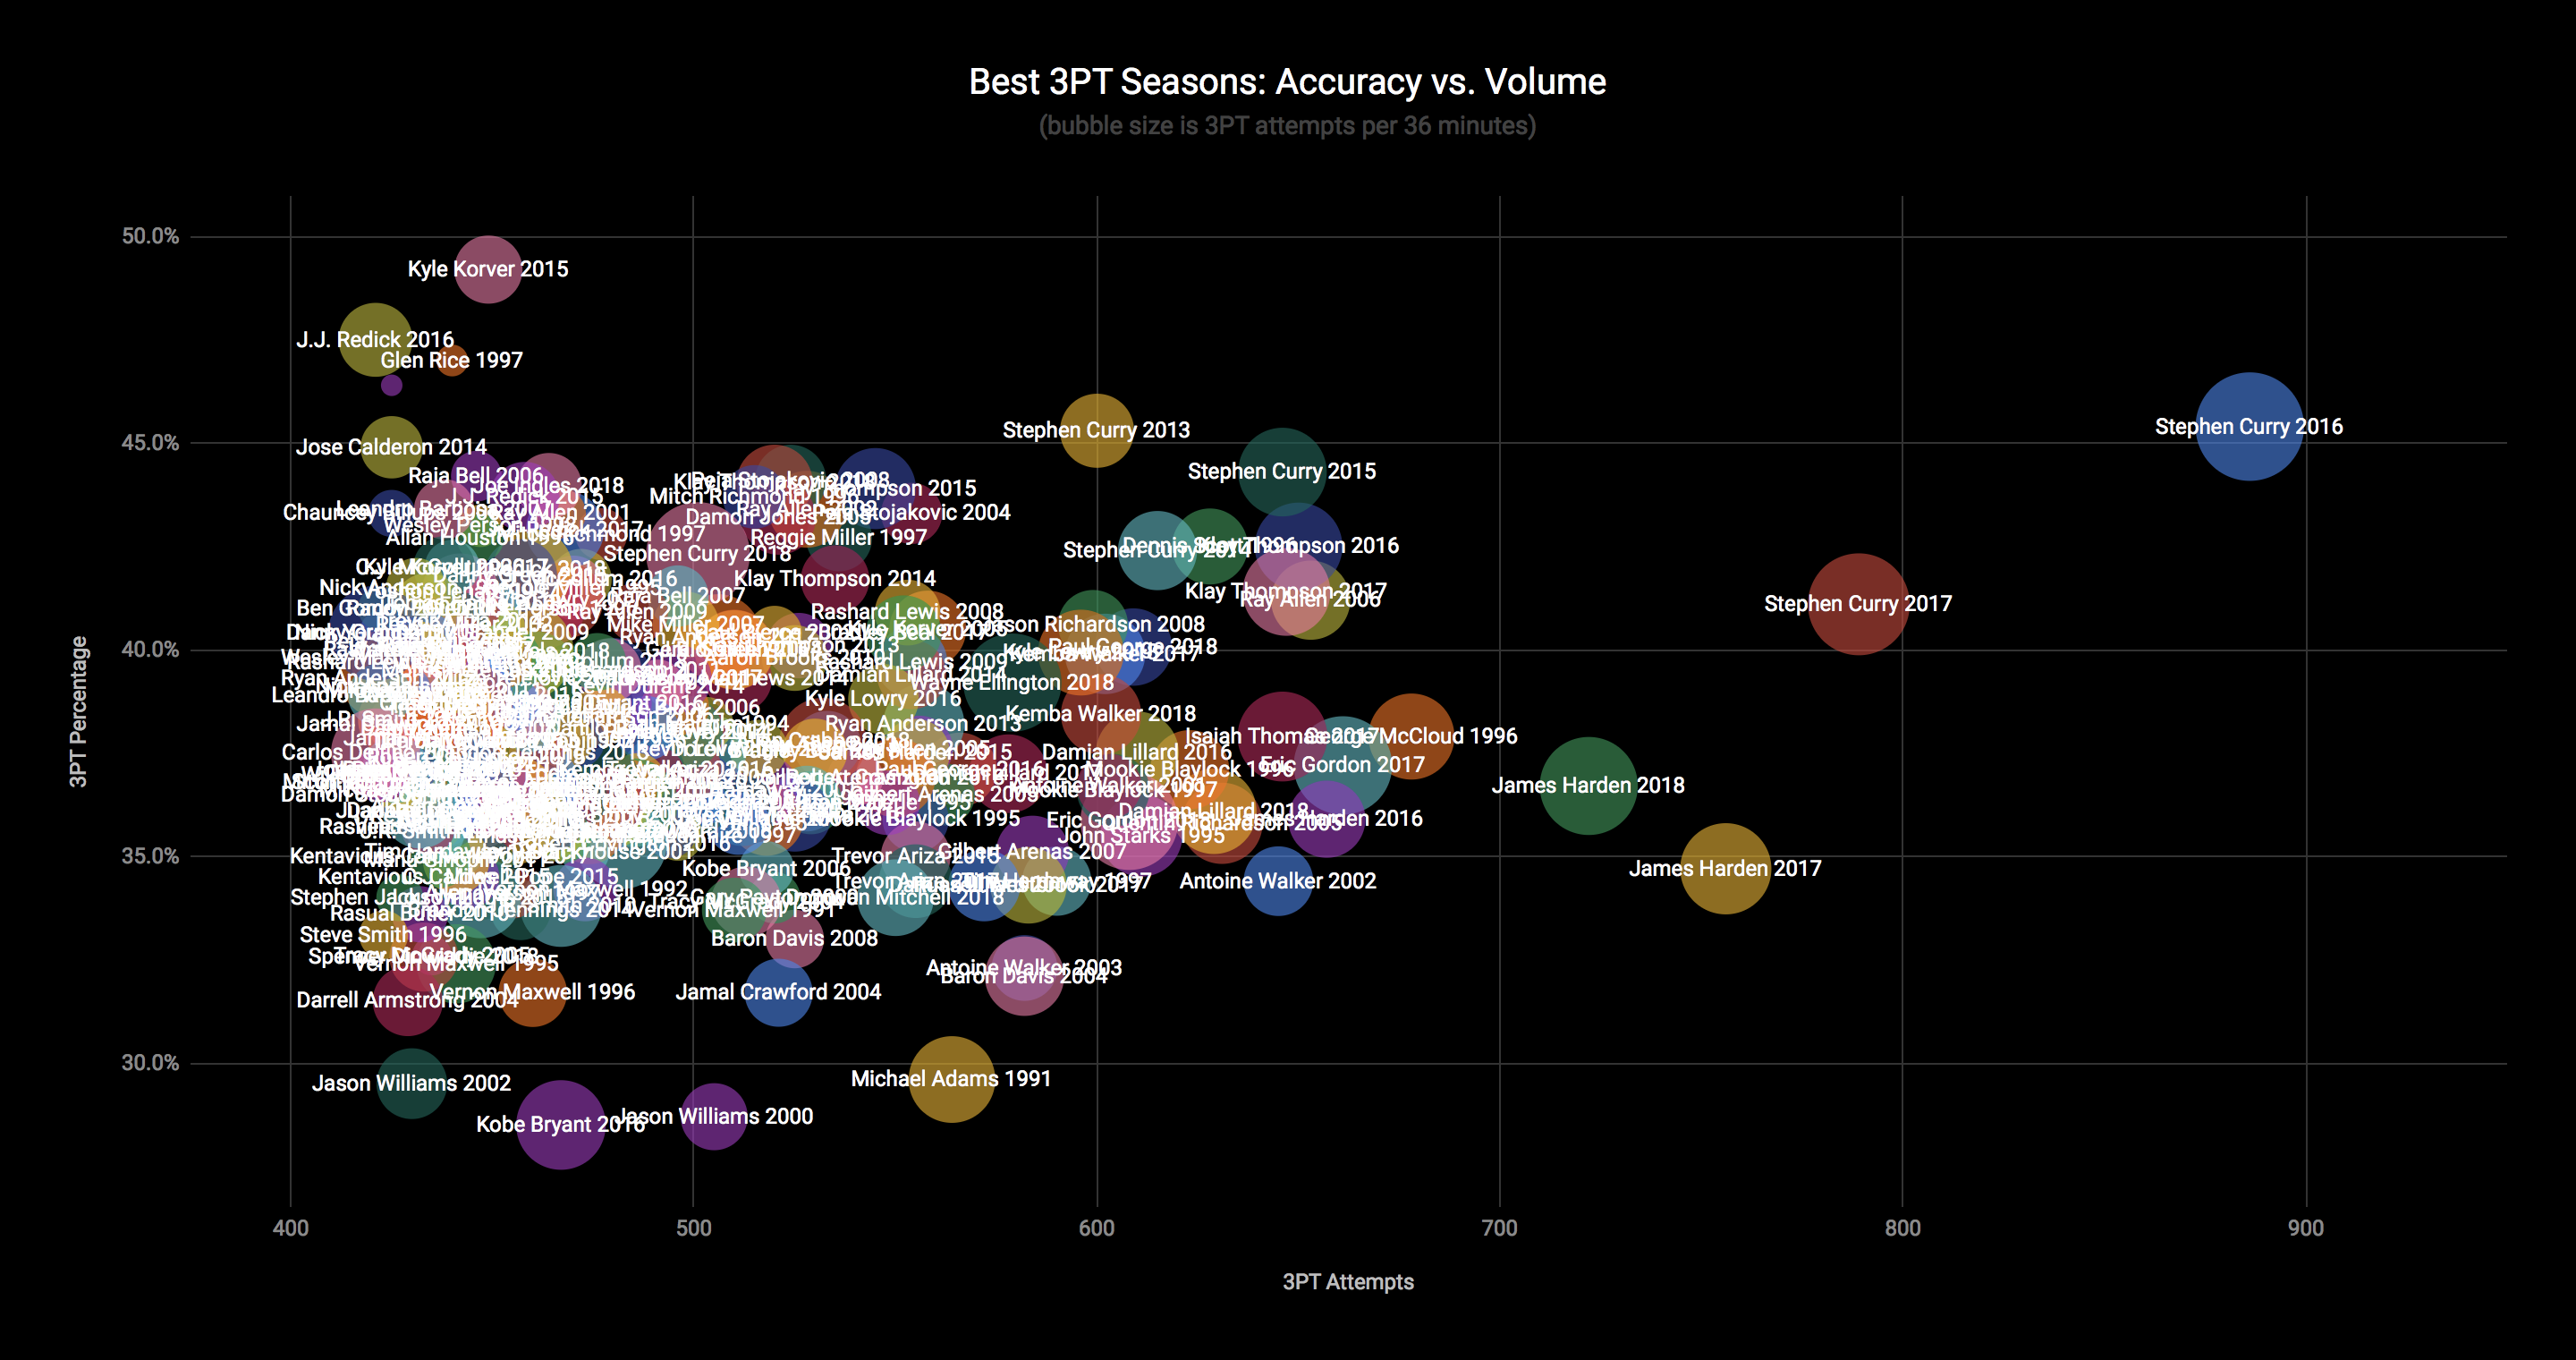
- This chart very simply shows why modern players will continue to jack 3’s. The four highest volume 3 point seasons all came in the past three seasons (it’d be the top 5 if Steph were healthy last season).
- Stephen Curry…LOL.
- Surprised to see James Harden here. His game seems so natural that it wasn’t obvious to me that he would be the second highest volume 3 point shooter in NBA history. Part of that is just a minutes thing - for example, Eric Gordon shot 3’s at roughly the same frequency but didn’t play as many minutes the past couple years.
- I’m glad to see Glen Rice’s crazy 1997 season here. That was the peak Glen Rice year and it came during the shortened 3 point line. Rice was absolutely on fire that year, seemingly able to go for 40 any night. He also won the All-Star game MVP, made All-NBA second team, and even finished fifth in MVP voting.
Accuracy vs. Volume for 2018 season only

- I’m including this just because it seemed good to review what happened last season.
- Curry has inspired an entire generation of lead guards to shoot off the dribble (Lillard, Kemba, Donovan Mitchell, Lou Williams).
- Yikes…Pascal Siakam…and that’s on 2.8 3 pointers attempted per 36 minutes.
Seasons: Accuracy vs. Frequency

- This chart captures a lot of the players that did not play enough minutes, but were highly efficient while they played. Essentially, this shows the specialists.
- You can clearly see the effect of the shortened 3 point line: the upper left corner is filled with seasons from 95-97 (Kerr, Legler, Schrempf).
- The reason the graph is shaped so weird is I filtered and sorted based on how far out to the right corner the players are. Hence, we get that perfect pareto-like line.
- Wow does CJ Miles stick out here. He attempted 12.2 3 pointers per 36 minutes. Or, put another way, that’s one 3 point shot for every 3 minutes on the court. That was his role coming off the bench, and he performed it to the extreme.
Outliers Seasons: Best and Worst Shooters

- For the next two charts, I’m measuring shooters against the averages for their season. I wanted to account for the fact that there were both fewer long distance shooters and that they less often in seasosn past. In this way, we can see which shooters were really outliers during their era. In this chart, the Y-axis represents the number of standard deviations from the average.
- Let’s finally talk about Steve Novak. I feel like I completely didn’t know how crazy Novak’s two seasons (2012 and 2013) with the Knicks were. The first season was the last D’Antoni season, and the 13 season was the magical year when the Knicks won 54 games. In those two seasons, Novak shot the 3 at a pace and efficiency that is unmatched by anyone else in NBA history except Stephen Curry. And this is not exactly a small sample size issue either - in 2012 Novak attempted 282 3 point shots! And he did that while averaging under 20 minutes a game. From the shooting aspect, Novak at 6-10 would be the perfect stretch 4. Of course, Novak didn’t posess much of the other skills required of a stretch 4 or really of any NBA rotation player, like playing good defense, rebounding for his size (he hovered around a 5-6% rebound rate in his two Knicks seasons), or having any type of driving threat. Still, I genuinely did know when I started this exercise that I would end up watching a Steve Novak highlights clip.
- Pau Gasol two seasons ago also should have perhaps gotten more attention. He made 53.8% of his 3’s that season, which is 4.3 standard deviations above the league average that year. Of course, this one likely is a small sample size issue: he only attempted 104 3 pointers that year, and last year his shooting regressed to 35.8%. And he didn’t attempt nearly enough 3’s before getting to San Antonio to get a better understanding of his abilities.
- Ouch Lance Stephenson, the only player ever to be more than 4 standard deviations worse than league average. He shot 17.1% on 105 attempts that year. Similar to Gasol, it’s not a huge number of attempts.
Outliers Seasons: 3 Point Chuckers

- This is probably my favorite chart - it looks at the chuckers, the ones that shot way more frequently than the rest of the league, and normalized for their era (see the explanation in the chart above).
- Let us once again celebrate Stephen Curry, who not only has shot the 3 more frequently than almost any other NBA player in history, but has also done it while being almost the most accurate relative to league average (held back only by a one low-minutes 3 point specialist season from Novak).
- So glad that JR Smith finally makes an appearance! Those two seasons (2007 and 2008) were in Denver, and it was really before the 3 point revolution had kicked off (remember, the finals matchup in 2007 was Cleveland vs. San Antonio, neither team having a particularly notable 3 point shooter).
- Shout out to Craig Hodges, one of the first 3 point specialists (and someone that clashed with MJ!).
- Sad to see Jason Williams in the lower left corner. He really was a special playmaker, and I almost want to credit him for his willingness to take the three, but perhaps he would’ve been better off making the extra pass.
- Kobe’s retirement season…I’m afraid to even comment on it, given the number of Kobe stans out there.
- And finally, Michael Adams is another player I had no memory of. I vaguely remember that 1991 Denver Nuggets team as being almost like a weird experiment gone wrong. They ran at a relentless pace and got shots up quickly. I remember even thinking it didn’t seem like basketball. This reddit post does a much better job of summing up how weird that one season was. But we really should celebrate Michael Adams, a 5-10 PG, who managed to be the biggest chucker in NBA HISTORY (relative to era), all while playing massive minutes (35+ per game), and shooting with less than 30% accuracy from 3. There truly never will be another Michael Adams season.
comments powered by Disqus